Log Parser Syntax
As stated previously, Log Parser commands are very similar to SQL queries. Let’s say you are looking for an event where the EventID = 4656. You could type the following command:
logparser "SELECT * FROM Security WHERE EventID = 4656"
If you are running this on the server, you can simply state the source to be “SECURITY” as shown above. Windows will know you are referring to the server’s local Security log. If you are running this on your own PC, you would type:
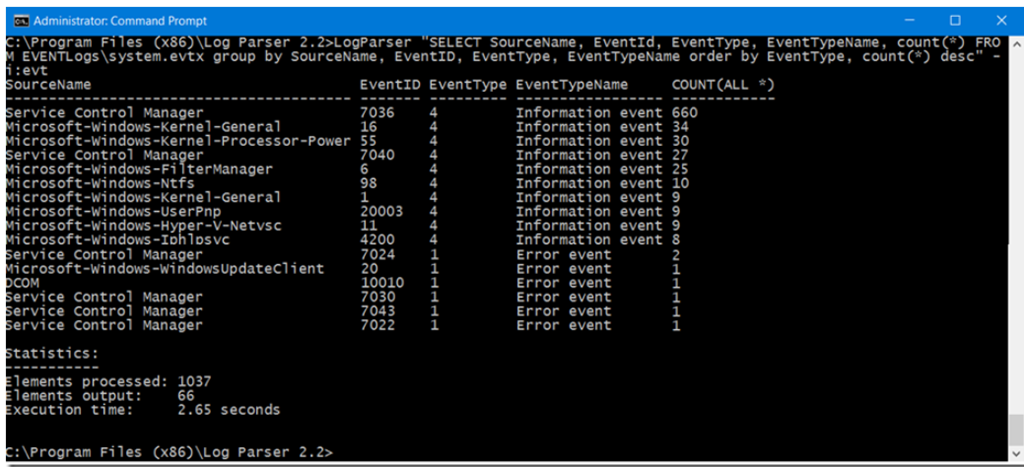
logparser -i:evt "SELECT * FROM <name and path to archive file> WHERE EventID = 4656"
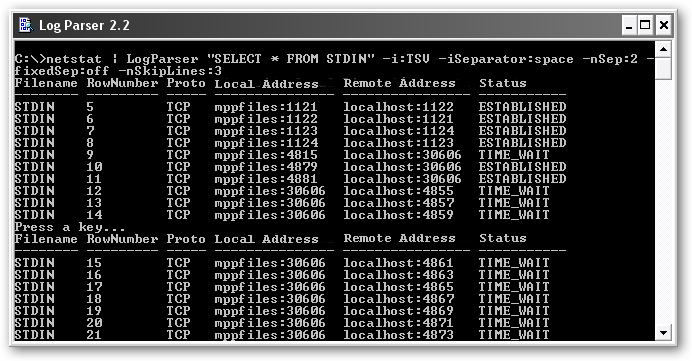
The above -i:evt switch means the file being used for input is an EVT file (which is the file type for Event Viewer). Alternatively, if you were searching against a text file for some other usage, you could simply put -i:txt. When you run the above commands, Windows will attempt to search the entire file. However, Windows will only output 10 entries at a time and you will get the “Press any key to continue prompt…” If you wanted this to search the entire file at once, you can add the -rtp:-1 to the end of the command.
For example:
logparser -i:evt "SELECT * FROM <name and path to archive file> WHERE EventID = 4656" -rtp:-1
Unfortunately, you will see Windows whiz by potentially hundreds of entries on your command prompt. The solution is to pipe the results to a text file.
For example:
logparser -i:evt "SELECT * FROM <name and path to archive file> WHERE EventID = 4656" -rtp:-1 >> c:\temp\my_results.txt
Unfortunately, we’ve added too much information into the text file. Even with Notepad++ or TextPad, reading through all this data can be time consuming as well. What would help is if we knew all the field types within the Event Viewer so that we could narrow things down a bit. Below is a list of fields used within the Event Viewer:
EventLog, TimeWritten, EventTypeName, SourceName, SID, RecordNumber, EventID, EventCategory Strings, Message, TimeGenerated, EventType, EventCategoryName, ComputerName, Data
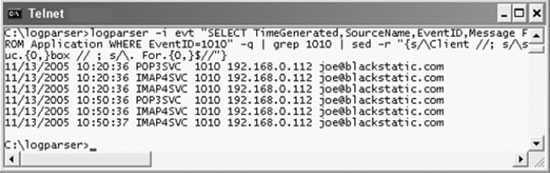
We can now be a bit more creative. Let’s do a search for the same EventID but limit the output to display only the TimeGenerated. Moreover, if we suspected that David Im altered the file, let’s modify the search to only include where his username appears (ex: sam). We could type:
logparser -i:evt "SELECT TimeGenerated FROM <name and path to archive file> WHERE ( EventID = 4656 ) AND ( Message LIKE %sam% )" -rtp:-1 >> c:\temp\my_results.txt
What if I want to automate this as a task? Well you can put this into a batch file and run it as a task via native Windows Task Scheduler or VisualCron. However, some modifications have to take place. For example, the % is a special character within Windows batch files that signals to the system that you are about to refer to a variable. Thus, for Message LIKE %sam%, you must modify the batch file to be Message LIKE ‘%%sam%%’. Notice it also required the single tick marks. You would also need single tick marks around EventID = ‘4656’.
Unfortunately, the above could still display (potentially) hundreds of entries. What if we want to narrow it down to events that occurred in the last 5 minutes? There is support for that as well. The syntax below assumes you are putting this into a batch file:
logparser -i:evt "SELECT TimeGenerated FROM <name and path to archive file> WHERE TimeGenerated >= TO_LOCALTIME( SUB ( SYSTEM_TIMESTAMP(), TIMESTAMP( '05', 'mm' ) ) ) AND ( EventID = '4656' ) AND ( Message LIKE '%%sam%%' )" -rtp:-1 >> c:\temp\my_results.txt
Как использовать просмотр событий Windows для решения проблем с компьютером
05.06.2014 windows | для начинающих Тема этой статьи — использование малознакомого большинству пользователей инструмента Windows: Просмотр событий или Event Viewer.
Для чего это может пригодиться? Прежде всего, если вы хотите сами разобраться что происходит с компьютером и решить различного рода проблемы в работе ОС и программ— данная утилита способна вам помочь, при условии, что вы знаете, как ее использовать.
Дополнительно на тему администрирования Windows
- Администрирование Windows для начинающих
- Редактор реестра
- Редактор локальной групповой политики
- Работа со службами Windows
- Управление дисками
- Диспетчер задач
- Просмотр событий (эта статья)
- Планировщик заданий
- Монитор стабильности системы
- Системный монитор
- Монитор ресурсов
- Брандмауэр Windows в режиме повышенной безопасности
Usage
$parser = new \Kassner\LogParser\LogParser();
$lines = file('/var/log/apache2/access.log', FILE_IGNORE_NEW_LINES | FILE_SKIP_EMPTY_LINES);
foreach ($lines as $line) {
    $entry = $parser->parse($line);
}
The object will hold all data parsed. If the line does not match the defined format, a will be thrown.
object(Kassner\LogParser\SimpleLogEntry)#4 (8) {
  =>
  string(14) "193.191.216.76"
  =>
  string(1) "-"
  =>
  string(8) "www-data"
  =>
  int(1390794676)
  =>
  string(26) "27/Jan/2014:04:51:16 +0100"
  =>
  string(53) "GET /wp-content/uploads/2013/11/whatever.jpg HTTP/1.1"
  =>
  string(3) "200"
  =>
  string(5) "58678"
}
Как открыть
Для запуска нажмите «Win+R», пропишите «control». Далее:
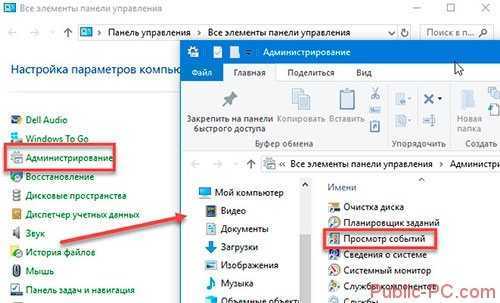
Другой способ
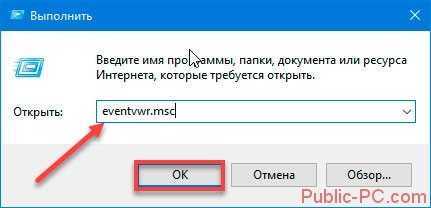
Нажмите (Win+R), пропишите «eventvwr.msc».
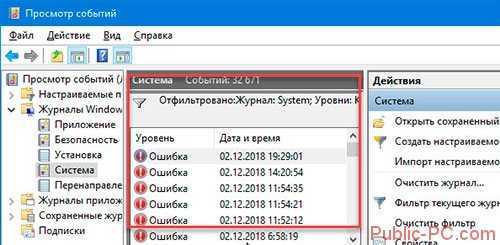
Откроется окно утилиты. Слева расположены журналы:
- приложений;
- служб;
- подписки.
Средняя колонка отображает события. Правая — действия. Ниже — сведения о выбранной записи.
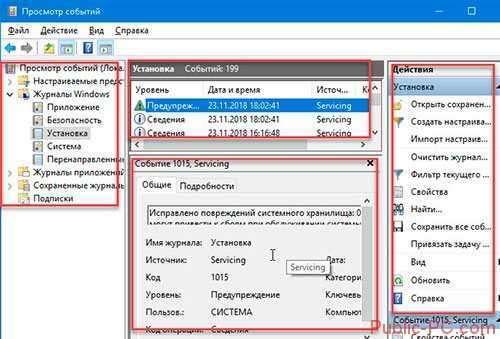
Работа происходит с разделом «Журналы», в который входят такие категории:
- Система. Содержит действия, которые созданы драйверами и модулями ОС;
- Установка;
- Безопасность. Информация о входе в аккаунты, учетные записи, доступ к файлам, установки процессов;
- Приложение. Информация про ошибки, созданные установленным софтом. Используются чтобы найти причину неработоспособности приложений;
- Перенаправление.
Отметьте пункты как на скриншоте:
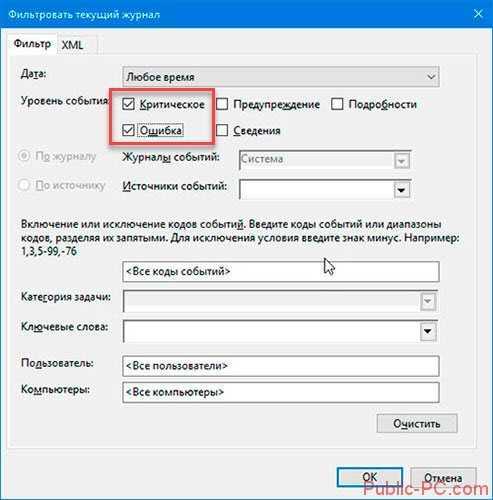
Утилита отфильтрует записи.
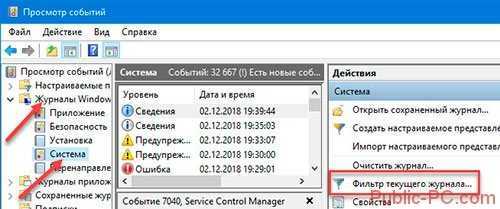
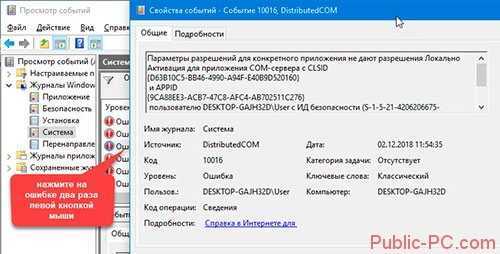
Просмотрите сообщение:
Step 6 — Exploring the Data in InfluxDB
When we installed InfluxDB, we also installed the Influx CLI client for connecting to and querying the database. We can launch this by simply running and using the database.
First let’s query our parsed data and see how many metrics we’ve got:
Perfect! This is the number of parsable metrics in the example log file.
Now let’s see how many errors we’ve returned using the function:
71 errors is quite a bit for only 600 requests in total! Let’s take a peek at a few of those errors using to grab all fields and to limit the number returned.
Looks like we’ve got some 404s. If we look closely, we can see that each of the 404s are coming from requests on the endpoint. Let’s see if every 404 is on that endpointfor this we will use the function.
Looks like there might be a few people getting 404 from the endpoint as well, so let’s see how many:
Great! Since there’s only one, this means that the main issue is users querying the endpoint, and now we can deal with finding out where that errant endpoint is coming from.
Customizations
Log format
# default Nginx format:
$parser->setFormat('%h %l %u %t "%r" %>s %O "%{Referer}i" \"%{User-Agent}i"');
Supported format strings
| Supported? | Format String | Property name | Description |
|---|---|---|---|
| Y | %% | percent | The percent sign |
| Y | %>s | status | status |
| Y | %A | localIp | Local IP-address |
| Y | %a | remoteIp | Remote IP-address |
| N | %B | — | Size of response in bytes, excluding HTTP headers. |
| Y | %b | responseBytes | Size of response in bytes, excluding HTTP headers. In CLF format, i.e. a ‘-‘ rather than a 0 when no bytes are sent. |
| Y | %D | timeServeRequest | The time taken to serve the request, in microseconds. |
| N | %f | — | Filename |
| Y | %h | host | Remote host |
| X | %H | — | The request protocol (this is Apache specific) |
| Y | %I | receivedBytes | Bytes received, including request and headers, cannot be zero. You need to enable mod_logio to use this. |
| N | %k | — | Number of keepalive requests handled on this connection. Interesting if KeepAlive is being used, so that, for example, a ‘1’ means the first keepalive request after the initial one, ‘2’ the second, etc…; otherwise this is always 0 (Y indicating the initial request). Available in versions 2.2.11 and later. |
| Y | %l | logname | Remote logname (from identd, if supplied). This will return a dash unless mod_ident is present and IdentityCheck is set On. |
| Y | %m | requestMethod | The request method |
| Y | %O | sentBytes | Bytes sent, including headers, cannot be zero. You need to enable mod_logio to use this. |
| Y | %p | port | The canonical port of the server serving the request |
| N | %P | — | The process ID of the child that serviced the request. |
| N | %q | — | The query string (prepended with a ? if a query string exists, otherwise an empty string) |
| Y | %r | request | First line of request |
| N | %R | — | The handler generating the response (if any). |
| X | %S | scheme | |
| N | %s | — | Status. For requests that got internally redirected, this is the status of the original request — %>s for the last. |
| X | %T | requestTime | The time taken to serve the request, in seconds. This option is not consistent, Apache won’t inform the milisecond part. |
| Y | %t | time | Time the request was received (standard english format) |
| Y | %u | user | Remote user (from auth; may be bogus if return status (%s) is 401) |
| Y | %U | URL | The URL path requested, not including any query string. |
| Y | %v | serverName | The canonical ServerName of the server serving the request. |
| Y | %V | canonicalServerName | The server name according to the UseCanonicalName setting. |
| N | %X | — | Connection status when response is completed: X = connection aborted before the response completed. + = connection may be kept alive after the response is sent. — = connection will be closed after the response is sent. |
| N | %{Foobar}C | — | The contents of cookie Foobar in the request sent to the server. Only version 0 cookies are fully supported. |
| N | %{Foobar}e | — | The contents of the environment variable FOOBAR |
| Y | %{Foobar}i | *Header | The contents of Foobar: header line(s) in the request sent to the server. Changes made by other modules (e.g. mod_headers) affect this. If you’re interested in what the request header was prior to when most modules would have modified it, use mod_setenvif to copy the header into an internal environment variable and log that value with the %{VARNAME}e described above. |
| N | %{Foobar}n | — | The contents of note Foobar from another module. |
| N | %{Foobar}o | — | The contents of Foobar: header line(s) in the reply. |
| Y | %{format}p | *Port | The canonical port of the server serving the request or the server’s actual port or the client’s actual port. Valid formats are canonical, local, or remote. |
| N | %{format}P | — | The process ID or thread id of the child that serviced the request. Valid formats are pid, tid, and hextid. hextid requires APR 1.2.0 or higher. |
| N | %{format}t | — | The time, in the form given by format, which should be in strftime(3) format. (potentially localized) (This directive was %c in late versions of Apache 1.3, but this conflicted with the historical ssl %{var}c syntax.) |
Entry object
Before it was possible to overwrite the entry object returned by overwriting the method. With strict types, this is no longer possible, so instead you have to use the newly created interfaces.
First, create two new classes, your entry object and a factory that is responsible of creating it:
class MyEntry implements \Kassner\LogParser\LogEntryInterface
{
}

class MyEntryFactory implements \Kassner\LogParser\LogEntryFactoryInterface
{
    public function create(array $data): \Kassner\LogParser\LogEntryInterface
    {
        // @TODO implement your code here to return a instance of MyEntry
    }
}
And then provide the factory as the second argument to the constructor:
$factory = new MyEntryFactory();
$parser = new \Kassner\LogParser\LogParser(null, $factory);
$entry = $parser->parse('193.191.216.76 - www-data [27/Jan/2014:04:51:16 +0100] "GET /wp-content/uploads/2013/11/whatever.jpg HTTP/1.1" 200 58678');
will be an instance of .
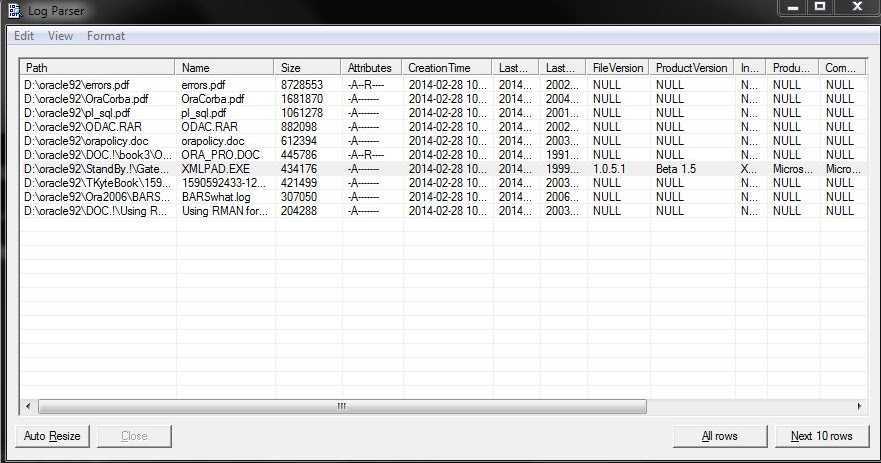
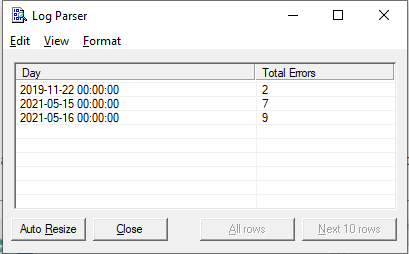
GUI for Logparser
On the unofficial Logparser Website you will find a small Utility which gives Logparser an rudimentary GUI. The GUI has only a few menu items. The function to save a query for later execution or edit is nice.
You can download the Logparser GUI from the following website http://www.logparser.com/simpleLPview00.zip.
No installation is required. Simply open the Window and enter your query.
The command SELECT * FROM System will show you all system event log entries on the local machine.
You can export the query results to a CSV file.
The command SELECT Path, Size FROM C:\temp*.* ORDER BY SIZE lists all files and subdirectories from c:\temp, ordered by file size, beginning with the smallest file size.
Configuration
Several parsing options are configured at the global level.
Global Configuration
Parsing rules options
Appears in the global Jenkins configs as section «Console Output
Parsing»
Configure pairs of logical names (project, description, etc.) and
parsing rule files.
Later on, when a job is configured for log parsing, you will be able to
choose one of these configurations to implement as the parsing rules for
that job. (See «Job Configuration»)
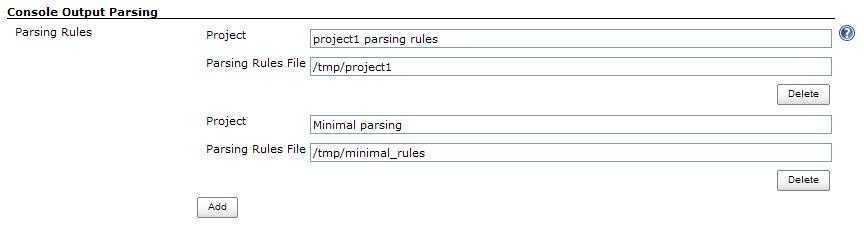
For each parsing rules option, specify :
Parsing rule name — logical name which will be displayed in the job
level configuration as an option
Parsing Rules File — A file with the parsing rules implemented in this
option. (See «Parsing rules files» to learn more about the syntax of
these files.)
Format
Each line in the file specifies a level (ok/error/warn/info/start) and a
regular expression (based on
java.util.regex.Pattern)
delimited by slashes («/») to look for in order to mark the line as
matching that level.
ok/error/warn
Used to identify problem lines.
info
These lines are highlighted blue in the report. They are used to
create a set of links into the report for quick access to certain
sections.
start
Like info lines, they are highlighted blue in the report, and
appear in the set of quick access links to the report. In addition,
they are used for grouping the list of errors and warnings found in
that section.
For example, the following line in the parsing rules file means that a
line including the word «ERROR» will be marked as an error line:
Case insensitive matches
The notation supports the Java regex embedded flag expression. To
perform a case-insensitive match, use (?i) notation.Example: to match lines starting with the case-insensitive word
‘error’, use:
error /(?i)^error /
If a line matches several rules, the first one applies.
So for the following set of rules :
ok /^javadoc:/
error /Error/
And the following line in the build log:
javadoc: Error : could not find something
The line will be considered «ok», and will not be highlighted as an
error, since the ^javadoc: pattern is matched first.
Lines starting with a ‘#’ character, and blank lines will be
ignored to allow comments and spacing.
Example parsing rules file:
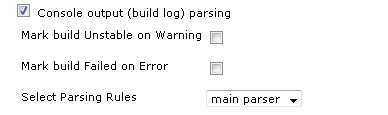
Job Configuration
- Go to menu: Jenkins -> ->
Configure - Go to section : Post-build Actions
- Check the «Console output (build log) parsing» checkbox.
- «Mark build Unstable on Warning» option: check to have parsed
warnings mark the build ‘unstable’. - «Mark build Failed on Error» option : check to have parsed errors
mark the build ‘failed’. - «Select Parsing Rules» : select the set of rules to use for parsing
the logs of this job’s builds
(Notice that this list is derived from the global configuration )
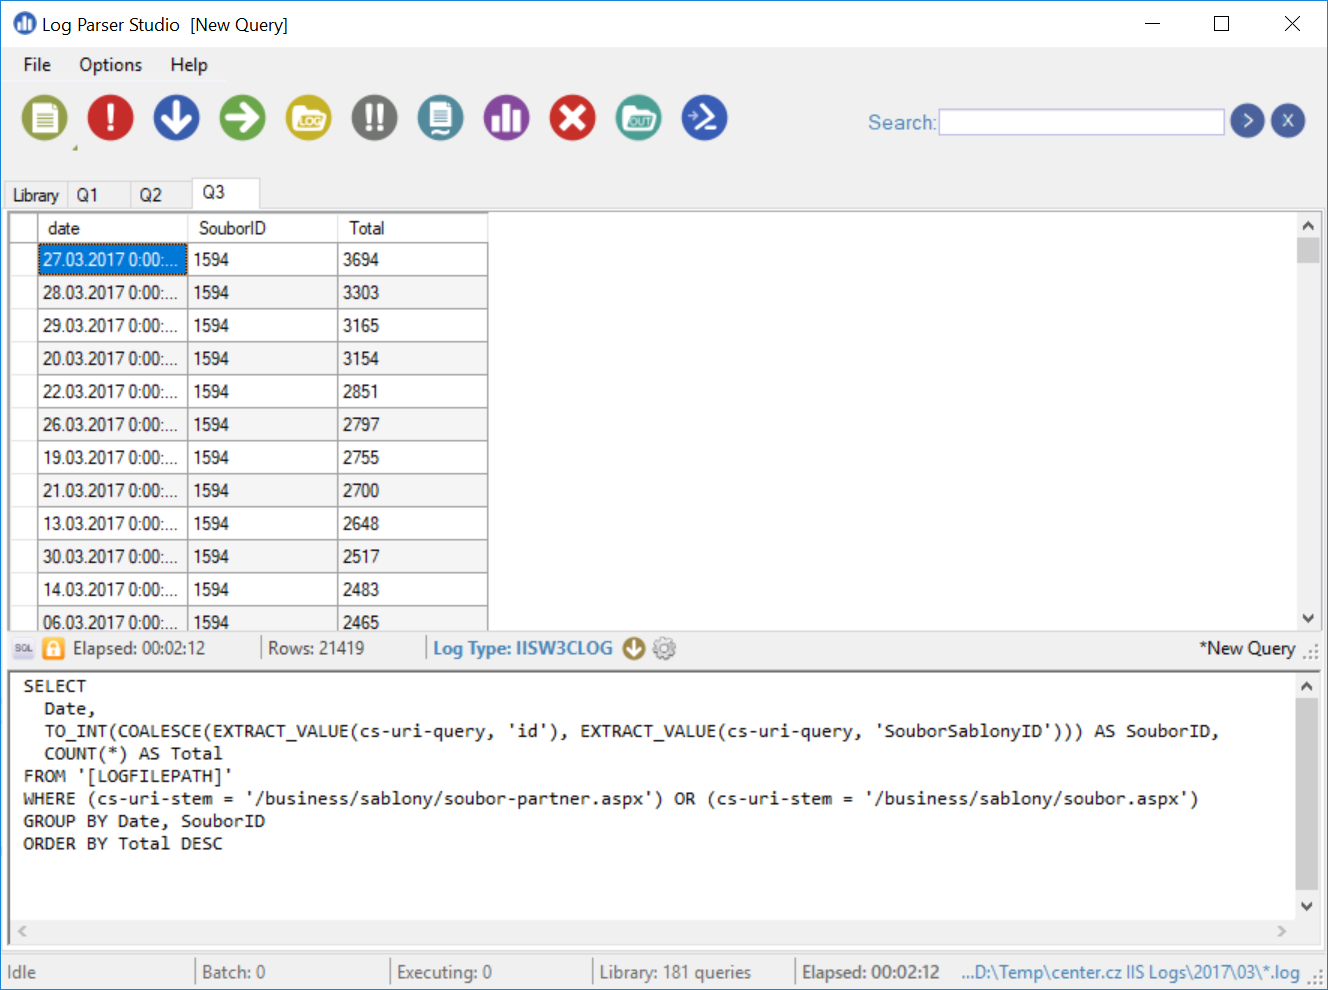
Introducing Log Parser
According to Microsoft, Log Parser “provides universal query access to text-based data such as log files, XML files, and CSV files, as well as key data sources on the Windows operating system such as the Event Log, the Registry, the file system, and Active Directory.” Also, it says, “The results of your query can be custom-formatted in text based output, or they can be persisted to more specialty targets like SQL, SYSLOG, or a chart.”
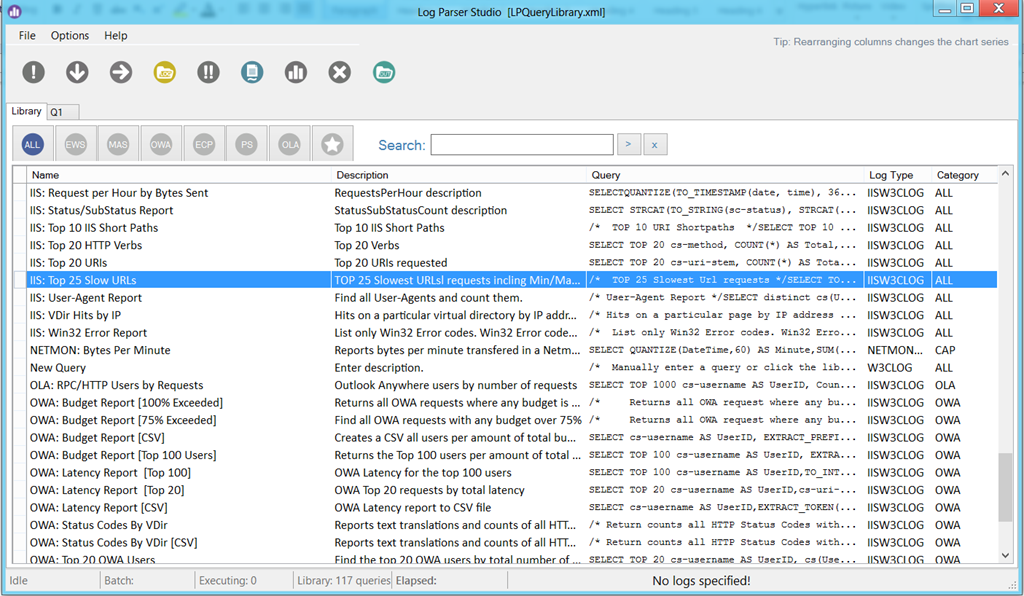
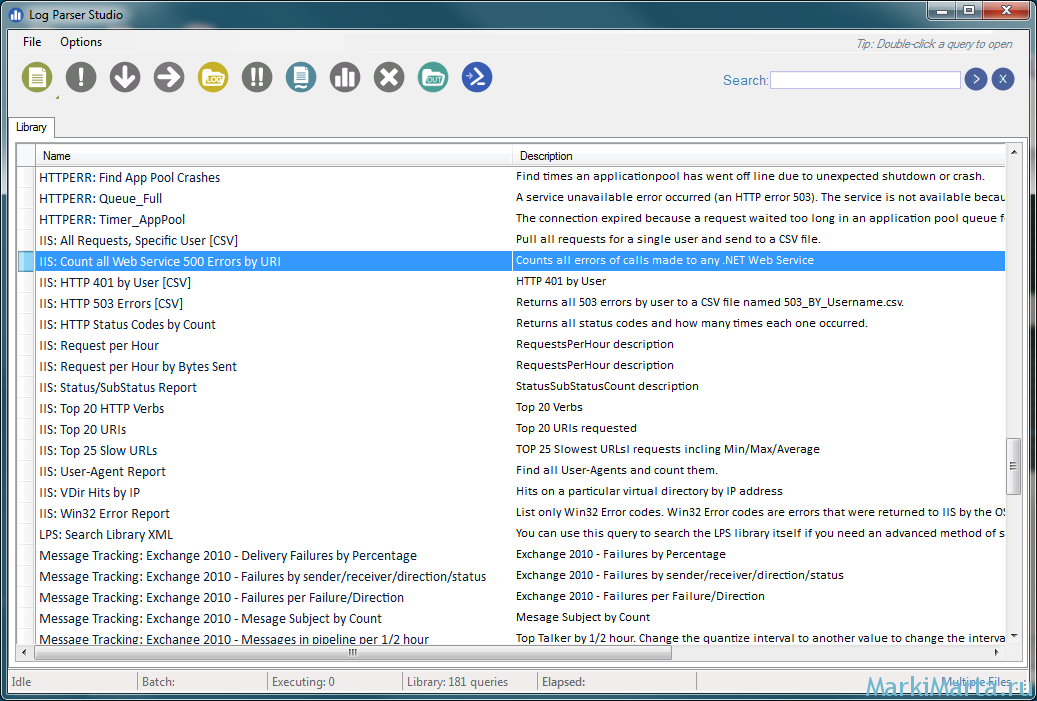
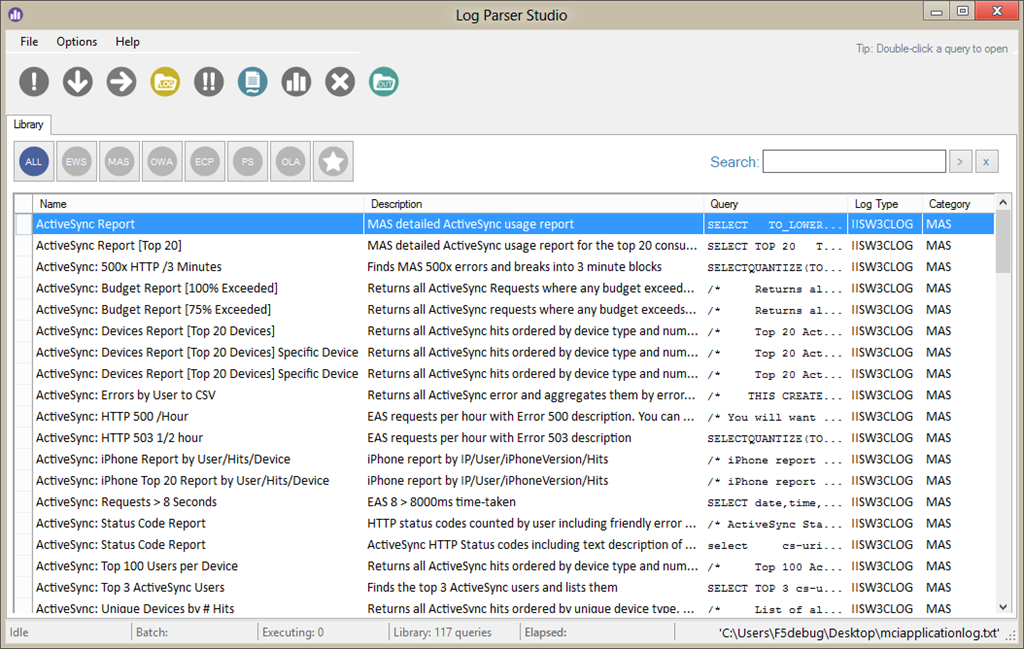
Installing Log Parser is easy. Just download the installer from Microsoft or use Chocolatey. Log Parser is a command-line tool. If you prefer, you can use Log Parser Studio, a graphical user interface that builds on top of Log Parser. Log Parser Studio also comes with many default queries, which is very useful if you’re using the tool for the first time.
Log Parser Input Formats
In the above query, it seems we selected certain columns from an “Application” table in some database. However, this “Application” points to the Application log of the Windows Event Log. In fact, this is what Log Parser calls an Input Format.
Log Parser has several Input Formats that can retrieve data from
- IIS log files (W3C, IIS, NCSA, Centralized Binary Logs, HTTP Error logs, URLScan logs, and ODBC logs)
- the Windows Event log
- Generic XML, CSV, TSV and W3C formatted text files
- the Windows Registry
- Active Directory Objects
- File and Directory information
- NetMon .cap capture files
- Extended/Combined NCSA log files
- ETW traces
- Custom plugins
In some cases, Log Parser can determine the Input Format for you. In our example, the tool knows that “Application” is an Event Log Input Format. Similarly, Log Parser knows which Input Format to choose when you specify an XML or CSV file.
If Log Parser can’t determine the Input Format, you can specify it with the “-i” option:
In this case, Log Parser will query the “errors.log” file using the CSV Input Format.
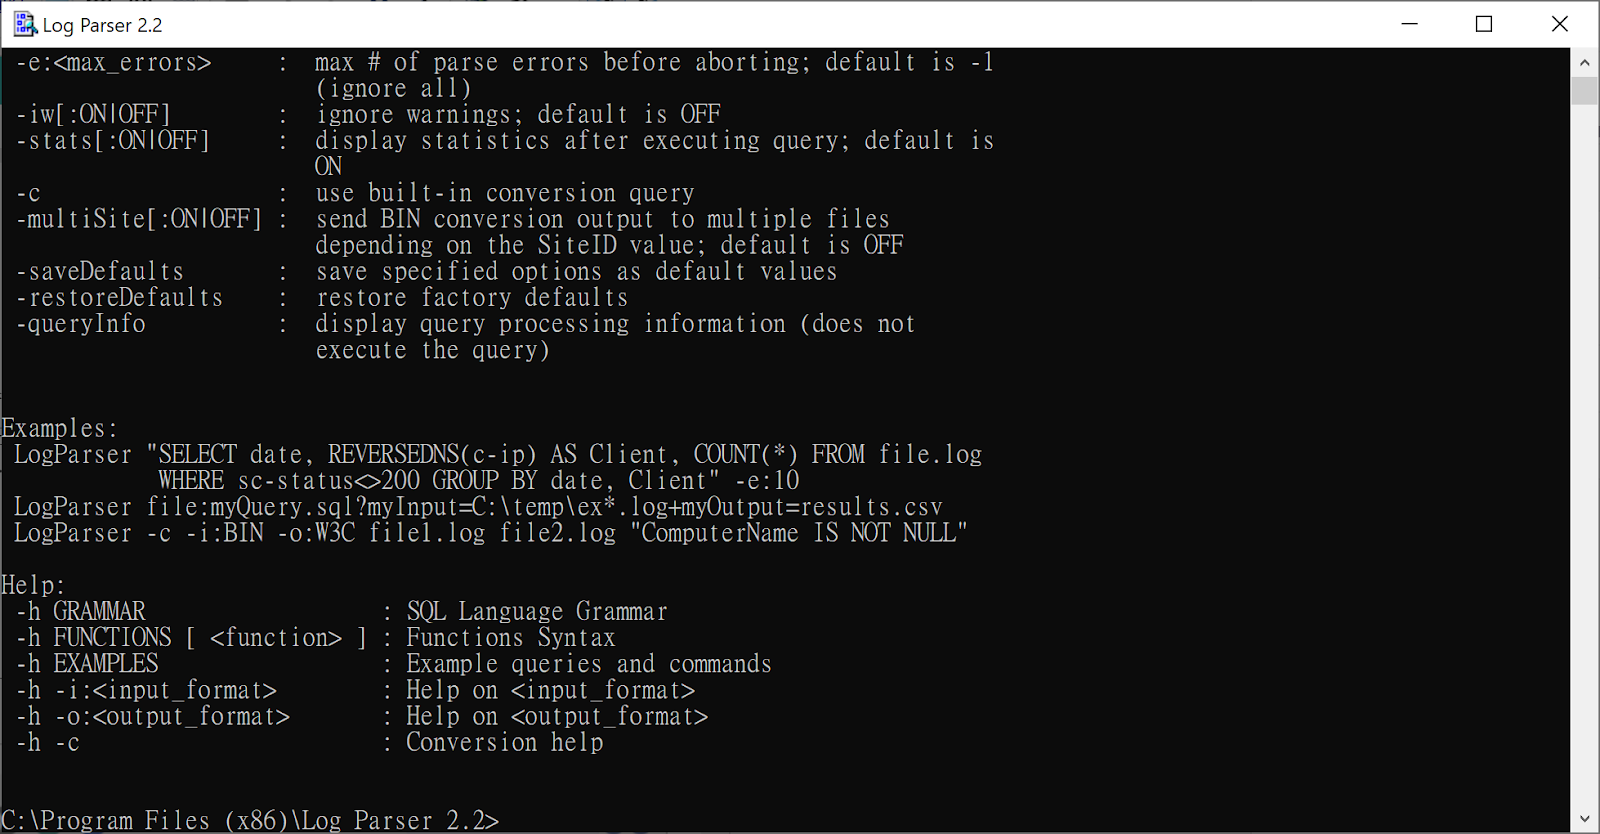
To see a complete list of all of the possible Input Formats, consult the help file (“Log Parser.chm”) that you’ll find in the Log Parser installation directory.
Запросы к данным
Простые запросы
Выбор всего
Самый простой (и наименее полезный) запрос, который можно выполнить, — это следующий код, который приведен здесь только для начала работы:
Давайте проанализируем, что делает этот запрос:
- Выбирает все поля («SELECT *») из всех записей во всех файлах журнала (FROM UrlScan.*.log)
- Указывает тип входных данных файла журнала в формате W3C («-i:w3c»)
Примечание
Указание формата входного файла в формате W3C имеет важное значение. Без этого шага вы не сможете проанализировать журналы UrlScan
Выбор определенных полей для запроса
Вы можете ограничить объем отображаемых данных, указав возвращаемые поля:
Вот что делает этот запрос:
- Выбирает только четыре определенных поля («SELECT date,time,c-ip,x-action») из всех записей во всех файлах журнала (FROM UrlScan.*.log)
- Указывает тип входных данных файла журнала в формате W3C («-i:w3c»)
Это позволяет значительно сократить объем информации, отображаемой в результатах.
Экспорт журналов в другой формат
Как упоминалось ранее, выбор всех записей во всех журналах, вероятно, не является полезным, если вы не заинтересованы в анализе сведений UrlScan с помощью другого приложения, например Microsoft Excel, Microsoft Access, SQL Server и т. д. В этом случае может потребоваться экспортировать все данные в файл с разделителями-запятыми, как показано в следующем примере:
Вот что делает этот запрос:
- Выбирает все поля («SELECT *») из всех записей во всех файлах журнала (FROM UrlScan.*.log)
- Вставка из всех записей в файл с разделителями-запятыми («INTO UrlScan.csv»)
- Указывает тип входного файла в формате W3C («-i:w3c»)
- Указывает тип выходного файла в формате CSV («-o:csv»)
Вы можете так же легко экспортировать в файл, разделенный вкладками, с помощью следующего синтаксиса:
Фильтрация запросов
Одна из больших вещей о LogParser и SQL-запросах в целом заключается в том, что можно отфильтровать объем данных, отображаемых путем указания критериев с помощью предложения WHERE. Осуществляется поиск в следующих
Фильтрация по IP-адресу
Например, чтобы просмотреть все запросы с определенного IP-адреса клиента, можно использовать следующий синтаксис:
Вот что делает этот запрос:
- Выбирает все поля («SELECT *») из всех записей во всех файлах журнала (FROM UrlScan.*.log)
- Фильтрует результаты по определенному IP-адресу клиента («WHERE c-ip=’192.168.1.1′»)
- Указывает тип входного файла в формате W3C («-i:w3c»)
Фильтрация на основе действия UrlScan
Вы также можете отфильтровать данные на основе отклонений UrlScan с помощью следующего синтаксиса:
Вот что делает этот запрос:
- Выбирает все поля («SELECT *») из всех записей во всех файлах журнала (FROM UrlScan.*.log)
- Фильтрует результаты, в которых UrlScan отклонил запрос (WHERE x-action=’Rejected'»)
- Указывает тип входного файла в формате W3C («-i:w3c»)
Фильтрация на основе уникальности
Вы можете отфильтровать объем отображаемых данных, указав поля для возврата и группировки данных на основе уникальности. Для этого добавьте предложение DISTINCT, как показано в следующем синтаксисе:
Вот что делает этот запрос:
- Выбирает только уникальные IP-адреса клиента (SELECT DISTINCT c-ip) из всех записей во всех файлах журнала (FROM UrlScan.*.log)
- Указывает тип входного файла в формате W3C («-i:w3c»)
Группирование, табуляция и сортировка запросов
Подсчет запросов по полям
Еще одна отличная функция запросов в стиле SQL — возможность табуляции данных. В следующем примере показано, как получить количество запросов на основе IP-адреса клиента:
Вот что делает этот запрос:
- Выбирает только IP-адрес клиента и число запросов (SELECT c-ip, COUNT(*)) из всех записей во всех файлах журнала (FROM UrlScan.*.log)
- Группирование количества запросов на основе IP-адреса клиента («GROUP BY c-ip»)
- Указывает тип входного файла в формате W3C («-i:w3c»)
Сортировка данных по полям
Вы можете изменить порядок результатов на что-то более полезное с помощью предложения ORDER BY, как показано в следующем примере:
Вот что делает этот запрос:
- Выбирает четыре конкретных поля (SELECT x-action, x-reason, c-ip,cs-uri) из всех записей во всех файлах журнала (FROM UrlScan.*.log)
- Сортирует данные в порядке возрастания на основе действия UrlScan и причины действия («ORDER BY x-action,x-reason»)
- Указывает тип входного файла в формате W3C («-i:w3c»)
Нюансы работы в журнале
Число обозреваемых событий может исчисляться тысячами и даже десятками тысяч. Для создания комфортных условий работы журнал событий в Windows 10 оснащен встроенным фильтром. Он позволяет отсортировать имеющуюся информацию по:
важности;
времени;
источнику;
имени компьютера и пользователя;
коду и прочим параметрам.
Но найти в журнале необходимую ошибку это полбеды. Специфичность содержащихся сведений не каждому позволит сходу понять в чём проблема. Например, пользователь может увидеть нечто вроде:
Регистрация сервера {BF6C1E47-86EC-4194-9CE5-13C15DCB2001} DCOM не выполнена за отведенное время ожидания
Поиск описания потребует выхода в интернет и посещения сайта Microsoft. Или иных ресурсов, предоставляющих подобную информацию.
Стоит упомянуть, что наличие ошибок – нормальное явление ОС. Любые, даже самые незначительные сбои вносятся в реестр. Так что не стоит переживать, обнаружив их в журнале.
Preprocessor
The preprocessor Python app is used to turn raw IIS logs into something more palatable for Log Parser. It does this by breaking single requests for many layers into many requests for single layers, parsing the string for MapSource/profile information, constructing bounding box information for different ways of specifying geometries and tagging each request with a type.
This is intended to be run as a Scheduled Task, but can be run as required.
Note: The preprocessor can currently only parse one directory of logs at a time. It should be pointed at the folder for the live website.
Configuration
The two entries in file that should be checked/changed are
folder=C:\path\to\source\log\files


strip_domains=True
This is the location from which to load IIS logs, e.g. .
This setting determines whether domain names are stripped from the cs-username field:
- If it is omitted or is one of , , or then domain names are not removed
- , , or means that all found domain names are removed
- Any other value is treated as a comma-separated list of domain names to remove. If your logs contain a mixture of down-level () and user-principal name () formats then both the styles have to be included, e.g.:
Username handling
Since the backslash separator in down-level usernames is used as a folder delimiter in Windows and is an escape character in Windows batch files, Python and SQL, these will be changed in the output files field to use the user-principal name style, e.g. CORP\EMPLOYEE in source files will become employee@corp in the prepared log and output files — unless the domain names are being removed as per the setting above.
iShare custom fields
-
— this indicates the type of the request which can be one of:
- — a map image request
- — a request for feature information
- — feature information exported to a file (or at least to a standard format)
- — printing to single image or PDF
- — image request for layer legend(s)
- — a request that gets information about the layer
- — the profile (a.k.a. MapSource) name of the request
- — the unique layer name (not the display name) of the layer in the request
- , ,, — coordinates of the bbox of the request
- , — coordinates of the centroid of the request
Основы журнала событий
2.1.Windows Logon Type
- Logon Type 2 Interactive Интерактивный вход в систему. Самый распространенный способ входа
- Logon Type 3 – Network Веб-вход в систему. Наиболее распространенным является доступ к общей сетевой папке или принтеру. Сертификация IIS также принадлежит Logon Type 3.
- Logon Type 4 – Batch запланированное задание
- Logon Type 5 – Service . Некоторые службы используют для запуска учетную запись домена. Обычная ситуация сбоя заключается в том, что администратор изменил пароль домена, но забыл изменить пароль службы.
- Logon Type 7 – Unlock Разблокируйте экран. Многие компании или пользователи имеют такие настройки безопасности: когда пользователь уходит на определенный период времени, экранная программа блокирует экран, разблокирует экран и вводит пароль учетной записи, генерирует это событие
- Logon Type 8 – NetworkCleartext Сетевой вход в систему в виде открытого текста, например службы ASP, которая появляется в IIS
- Logon Type 9 – NewCredentials Вход в систему с новой идентификацией обычно происходит во время проверки входа в программу, работающую в режиме RunAS
- Logon Type 10 – RemoteInteractive Удаленный вход в систему генерирует событие 10
- Logon Type 11 – CachedInteractive Чтобы упростить работу пользователей ноутбуков, компьютер кэширует первые десять успешных входов в систему.
2.2 Общий идентификатор события
Common Issues & Troubleshooting
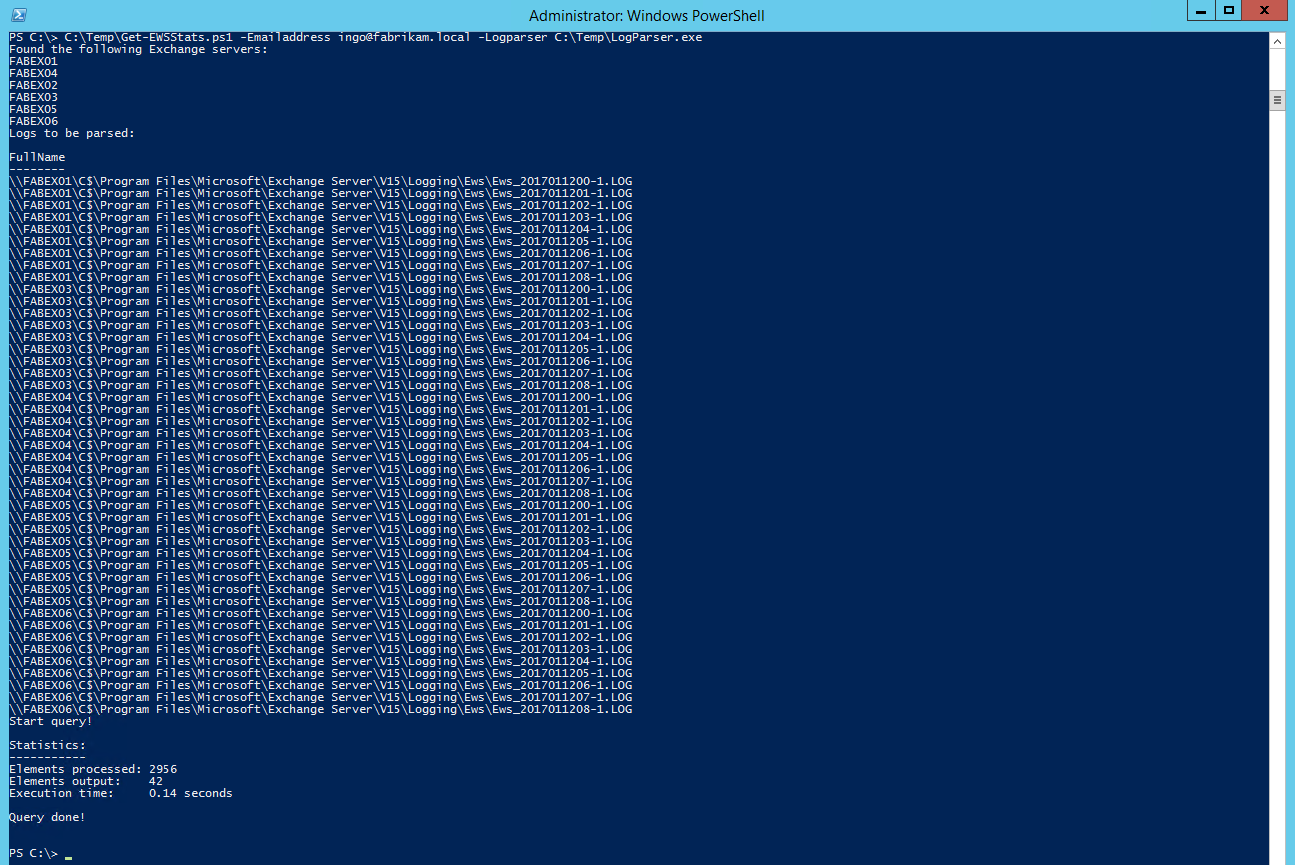
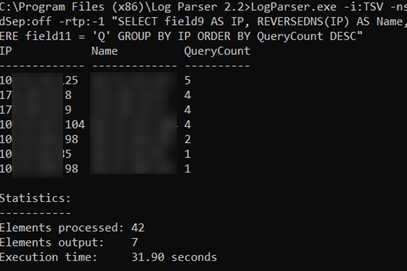
If you are not getting back any results with your query, it might be because X-Forwarded-For data has been added to your IIS logs. X-Forwarded-For is a mechanism to allow load balancers to forward the original client IP to the Exchange server. This is useful when the client IP column (a.k.a. c-Ip) is only returning the load balancers IP.
However, this may cause zero results to be returned. To fix this, switch your query to use a log type of W3CLOG (rather than IISW3CLOG).
What applications have you identified when parsing the Exchange logs? Drop a comment below or join the conversation on Twitter @SuperTekBoy
Log Parser Output Formats
Once you have a query with some results, you’ll probably not want to keep writing the output to the command-line. Collecting and parsing logs is usually the first step of a bigger process. You might want to run some operations on them, get stats, or send them to a dashboard for analysis, etc. And different use-cases might require different formats of data. Log Parser supports several Output Formats:
- Text files: CSV, TSV, XML, W3C, user-defined, etc.
- A SQL database.
- A SYSLOG server.
- Chart images in GIF or JPG format.
To write the results to a file, you can simply add the “INTO” clause to your query. To continue with our example, this query will write the results to a CSV file:
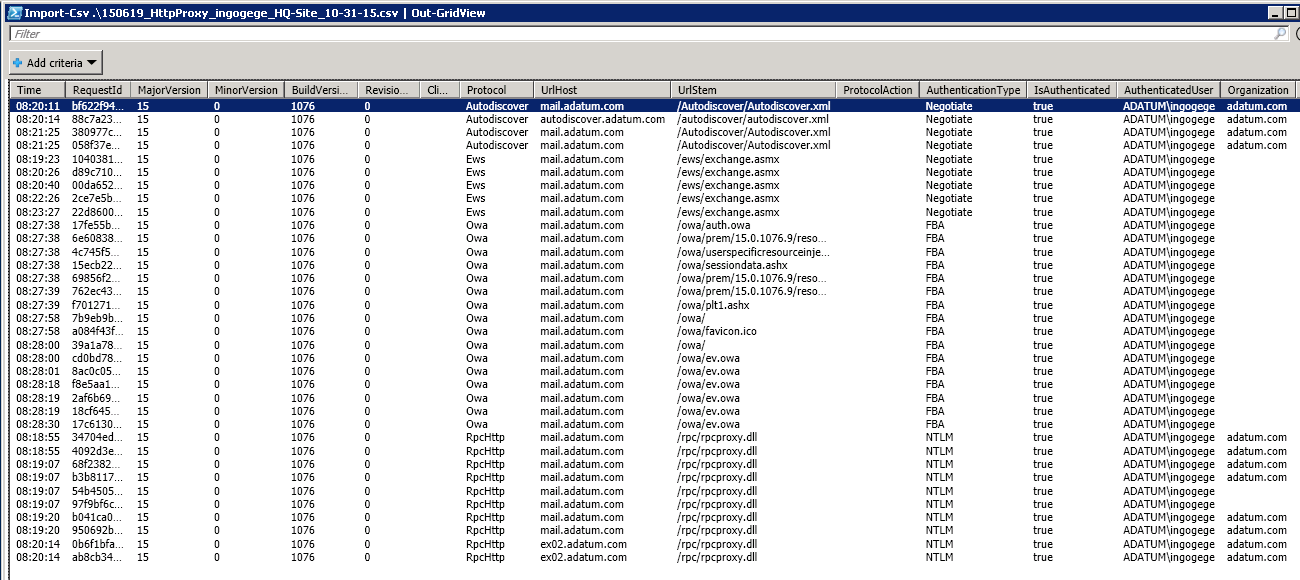
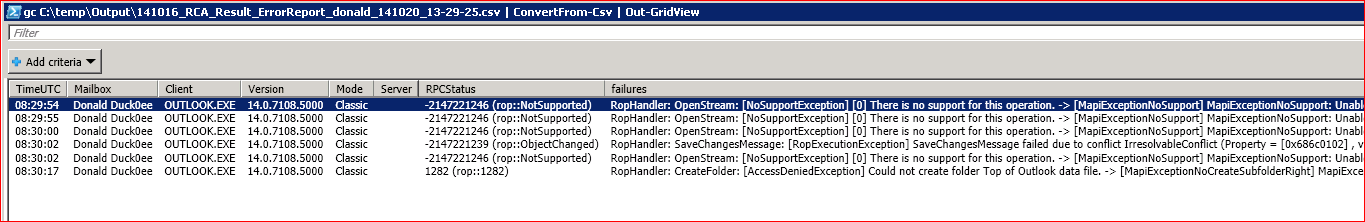
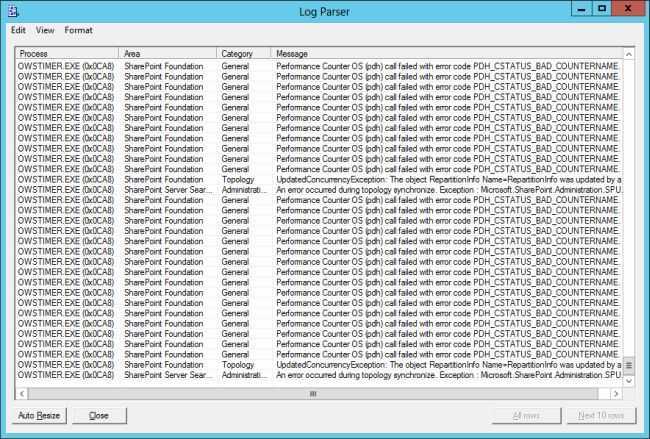
Just like Input Formats, Log Parser is smart enough to use the correct Output Format in some cases. In our example, the file had a CSV extension. So it makes sense to use the CSV Output Format. If you want to specify the Output Format, you can do so with the “-o” option:
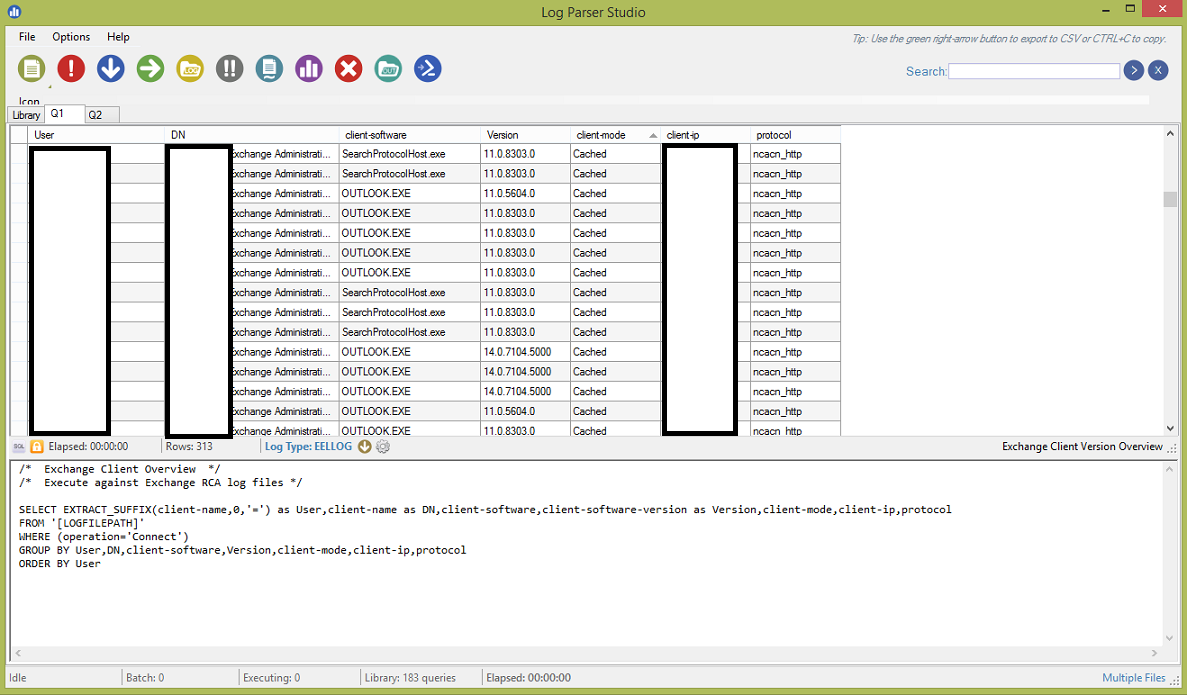
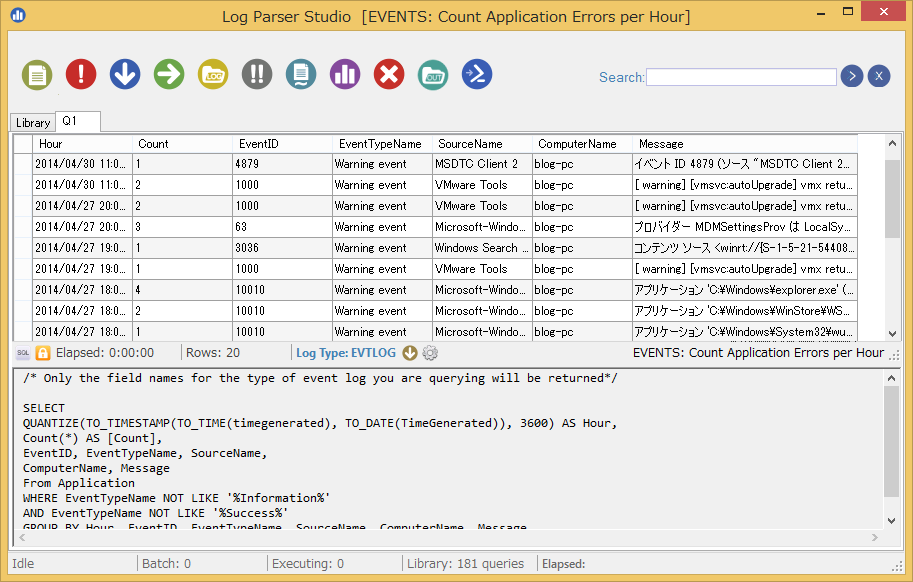
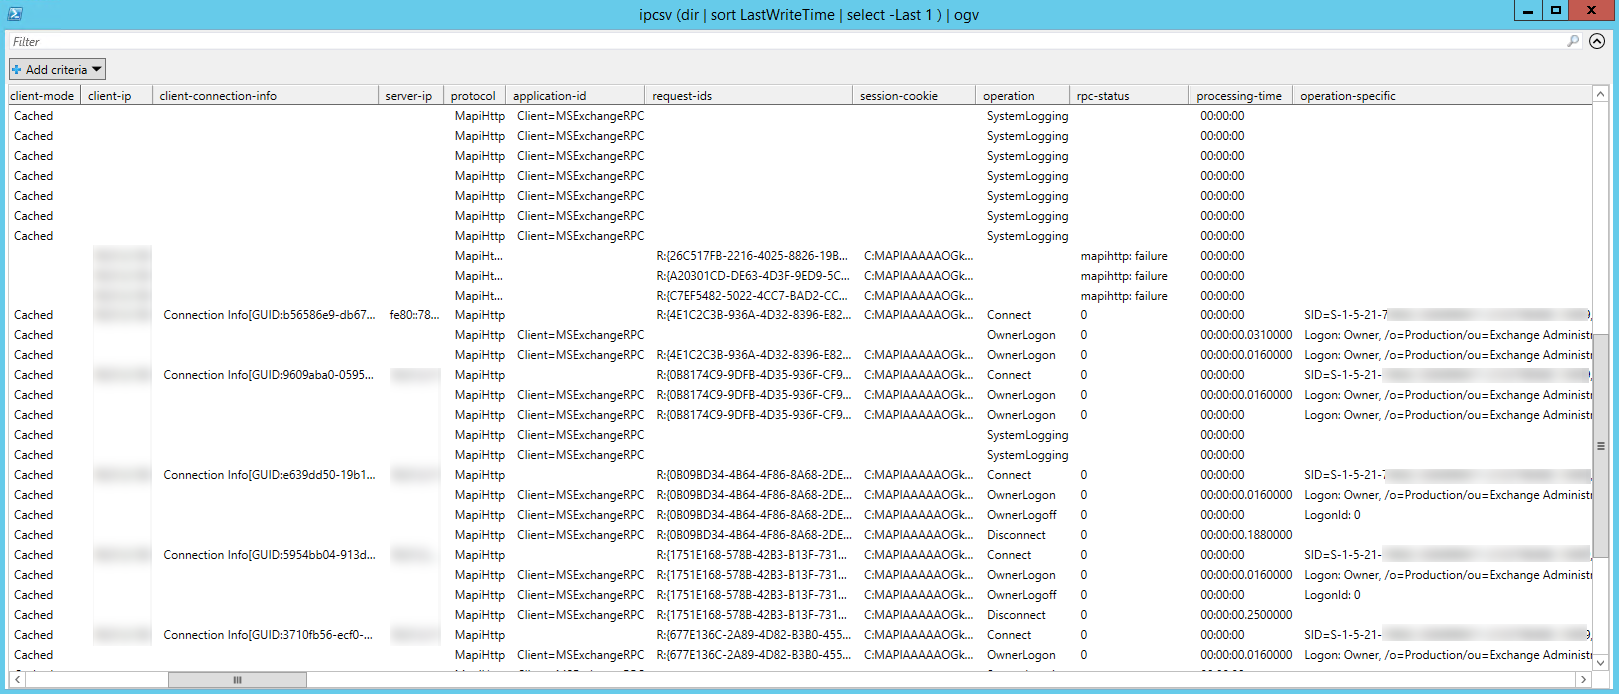
This will open a window with a data grid:
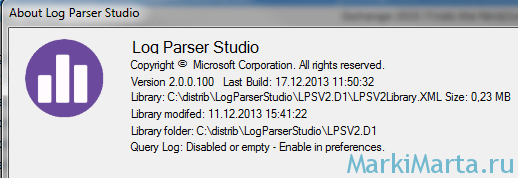
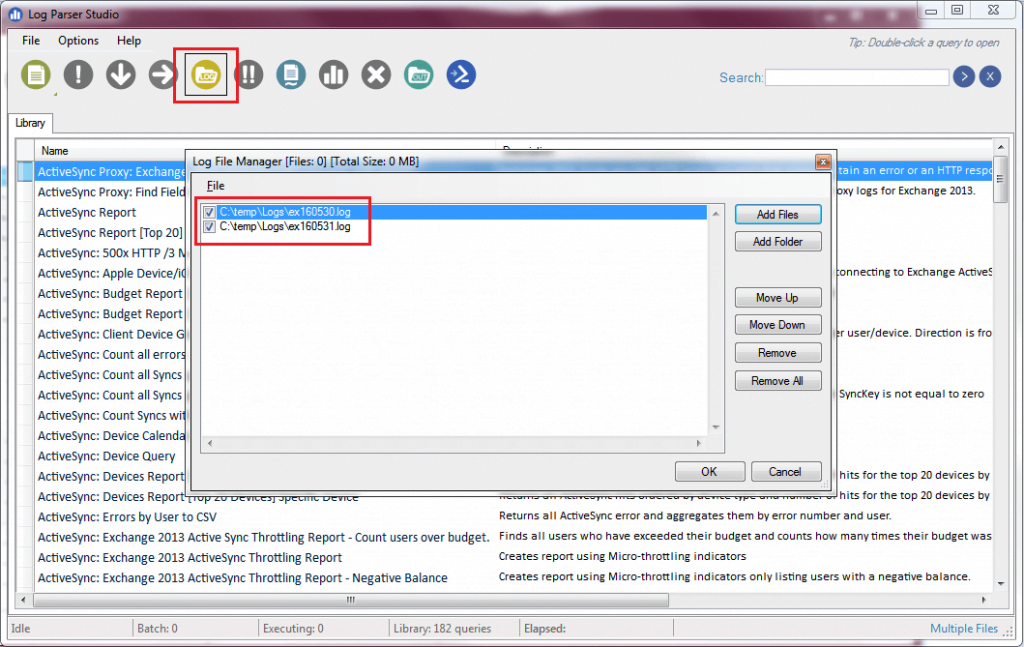
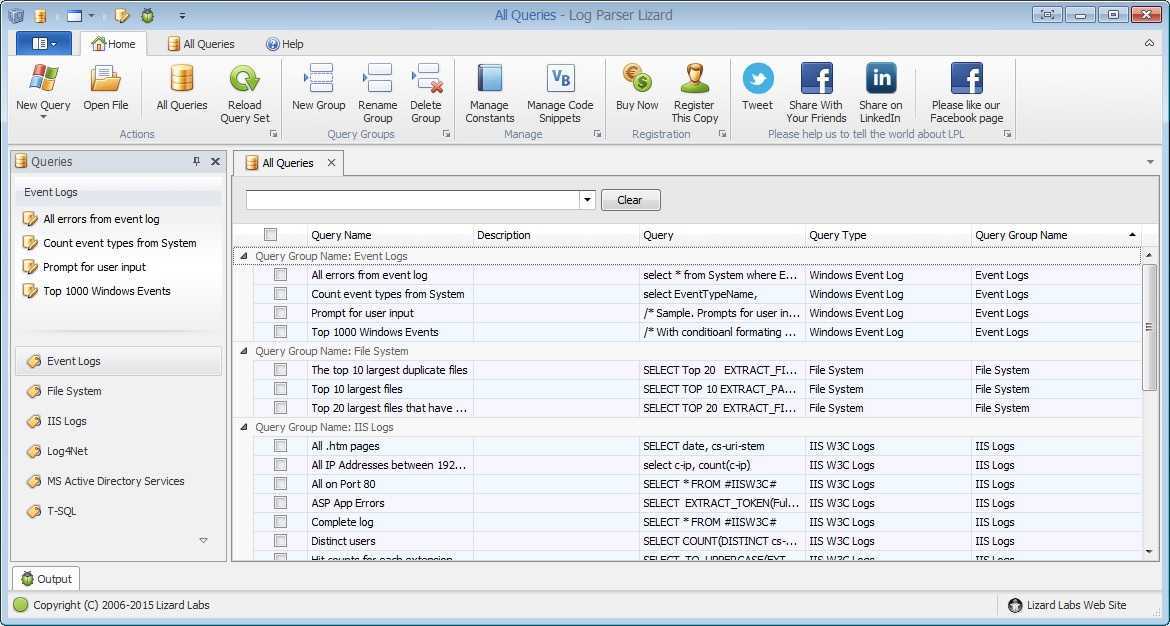
Importing queries into Log Parser Studio
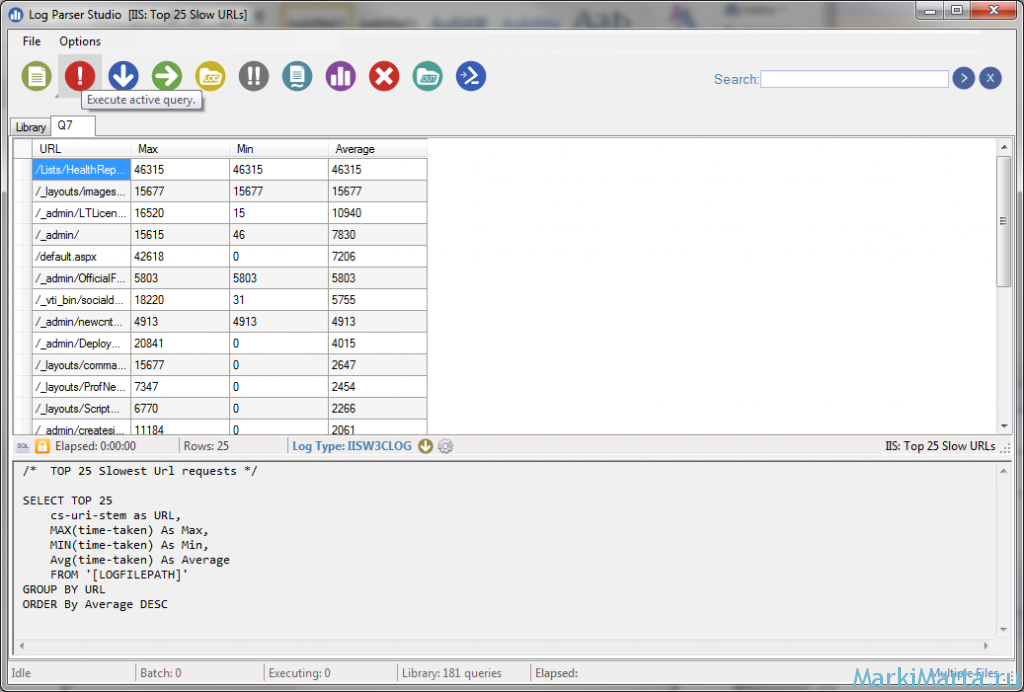
As you can see from the screenshot above, Log Parser Studio (or “LPS” for short) ships with dozens of pre-canned SQL queries that can aid you in all sorts of troubleshooting and reporting. For example, the query “EWS: Exchange 2013 – Top 1,000 EWS requests by CPU used” helps identify all your EWS resource hogs.
However, for use with your migration discovery, here are a few more SQL queries for you to download and import into LPS. We will be using one of these throughout the rest of the article.
Log Parser Studio Migration Discovery Queries v22.01Download
Once downloaded and unzipped you can import them into LPS by navigating to the File menu and selecting Import > XML to Library. From the Import XML Library dialog, select all XML files and click Open. From the Query Import dialog select Merge Now.
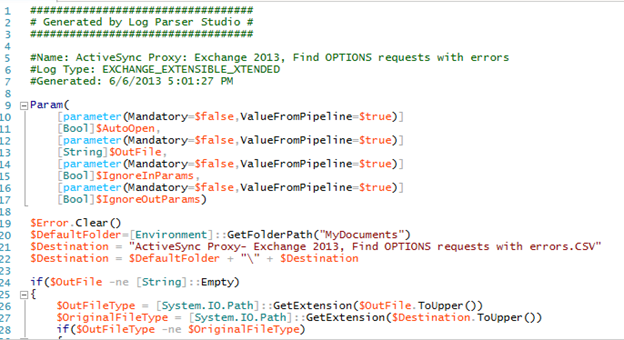
The queries will be imported. They are prefixed with an exclamation point so they appear at the top of the query list.
Note: If you wish to change the query name be sure to edit the XML file before importing into LPS.